GeoEstimaLib: Our Python Library for Geostatistics
In recent years, we at GeoEstima have adopted Python as a fundamental tool in our workflows. Python is a high-level, interpreted, general-purpose programming language. It is also open source, meaning anyone can freely use, modify, and improve it. Its popularity in data analysis is largely due to its clear syntax and the vast number of available libraries that make it possible to work efficiently with large volumes of data.
Thanks to Python, we’ve been able to efficiently handle the large files we work with on a daily basis, such as block models generated during mineral resource estimation processes. This tool has been essential both in the exploratory analysis of databases and in model validation, facilitating the creation of custom plots that support better interpretation of results.
👉 You can learn more about this process on our blog: Relevant Aspects to Consider During a Mineral Resource Model.
In addition to data analysis, Python allows us to automate various internal processes, such as project time tracking and polygon tagging directly on the block model, thereby improving operational efficiency and reducing manual errors.
Development of an Internal Library
As we developed various scripts, we saw the need to distribute this knowledge in a more structured way among our team members. This led to the implementation of a more robust solution: the development of an internal Python library.
A Python library is a collection of modules containing reusable functions, classes, and objects designed to perform specific tasks and extend the capabilities of the language. By organizing our code into a library, we were able to:
- Maintain version control
- Facilitate collaboration and maintenance
- Ensure proper code functionality
- Guarantee traceability of changes
Currently, our library is at version 2.3.3 and is hosted in a private GitHub repository.
Main Modules of the Library
The library includes several specialized modules that support the key stages of analysis and validation in mineral resource estimation:
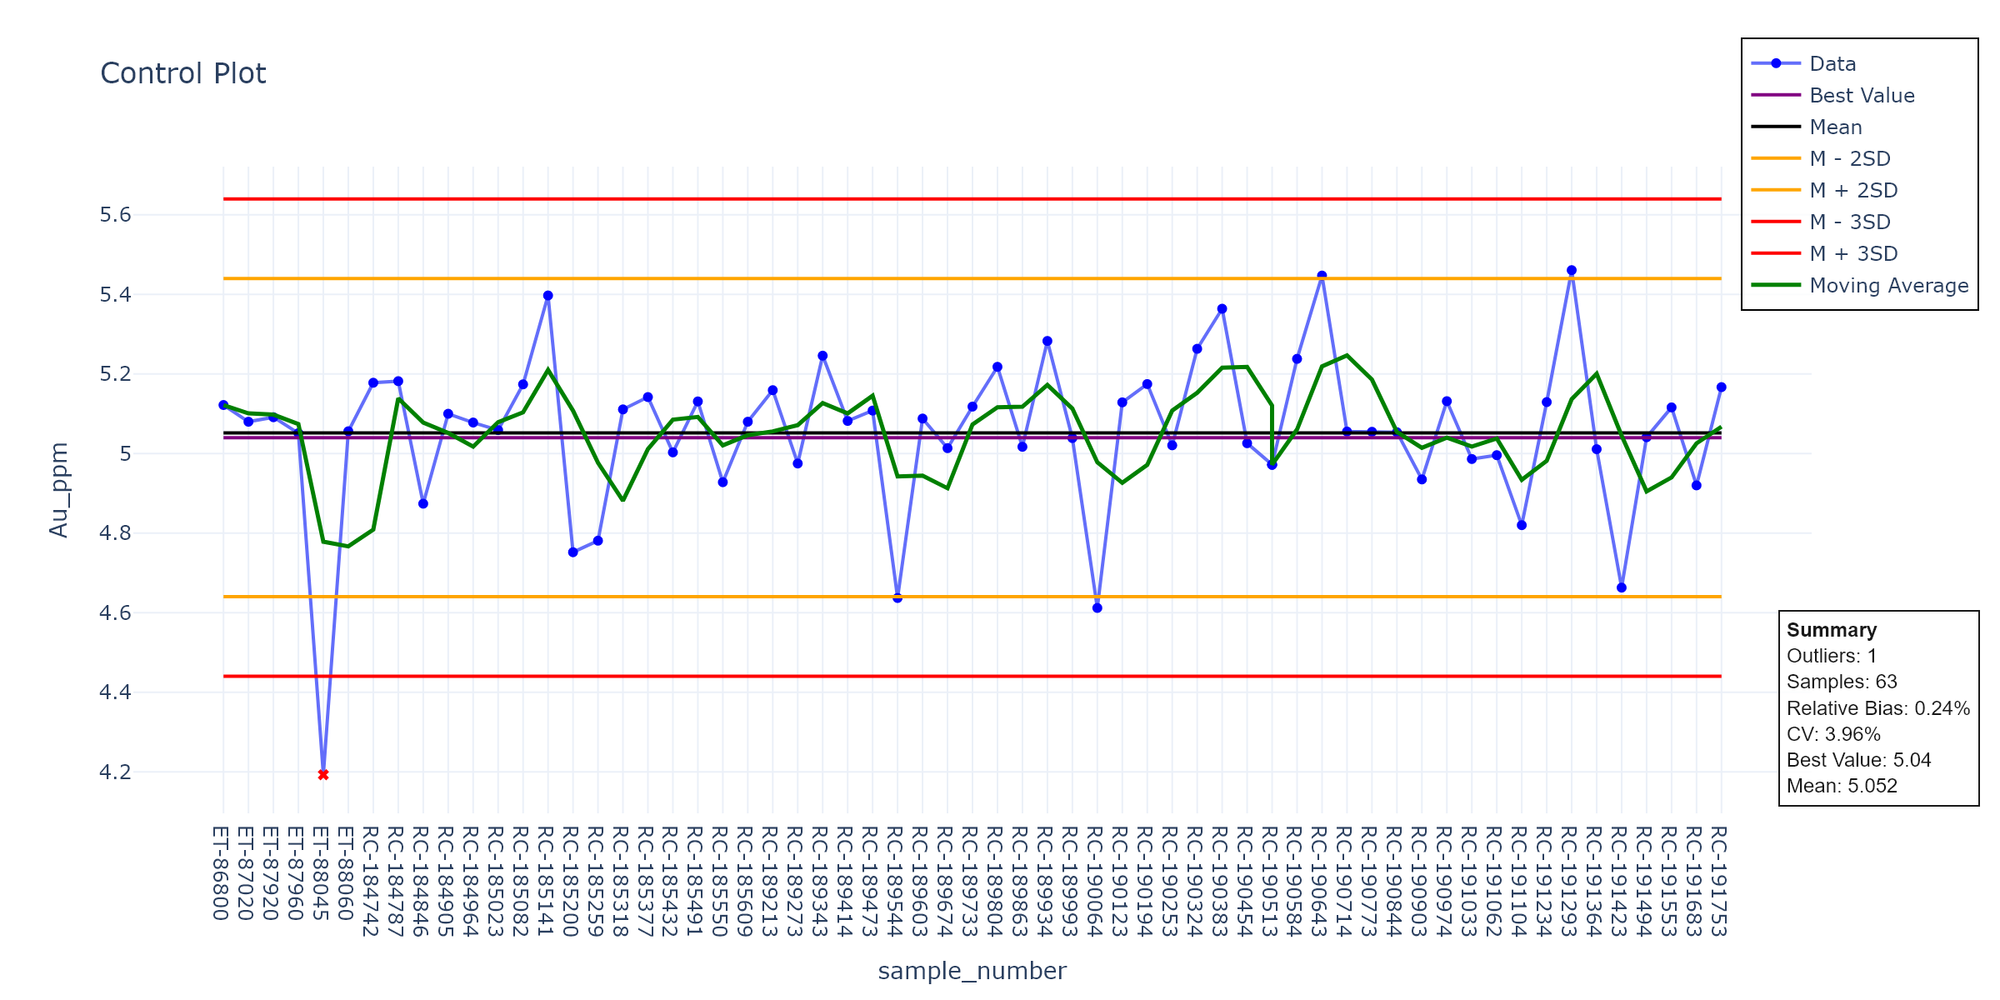
• QAQC Module
Includes dedicated plots for sample quality control, such as analysis of duplicates, blanks, and standards.
• EDA Module (Exploratory Data Analysis)
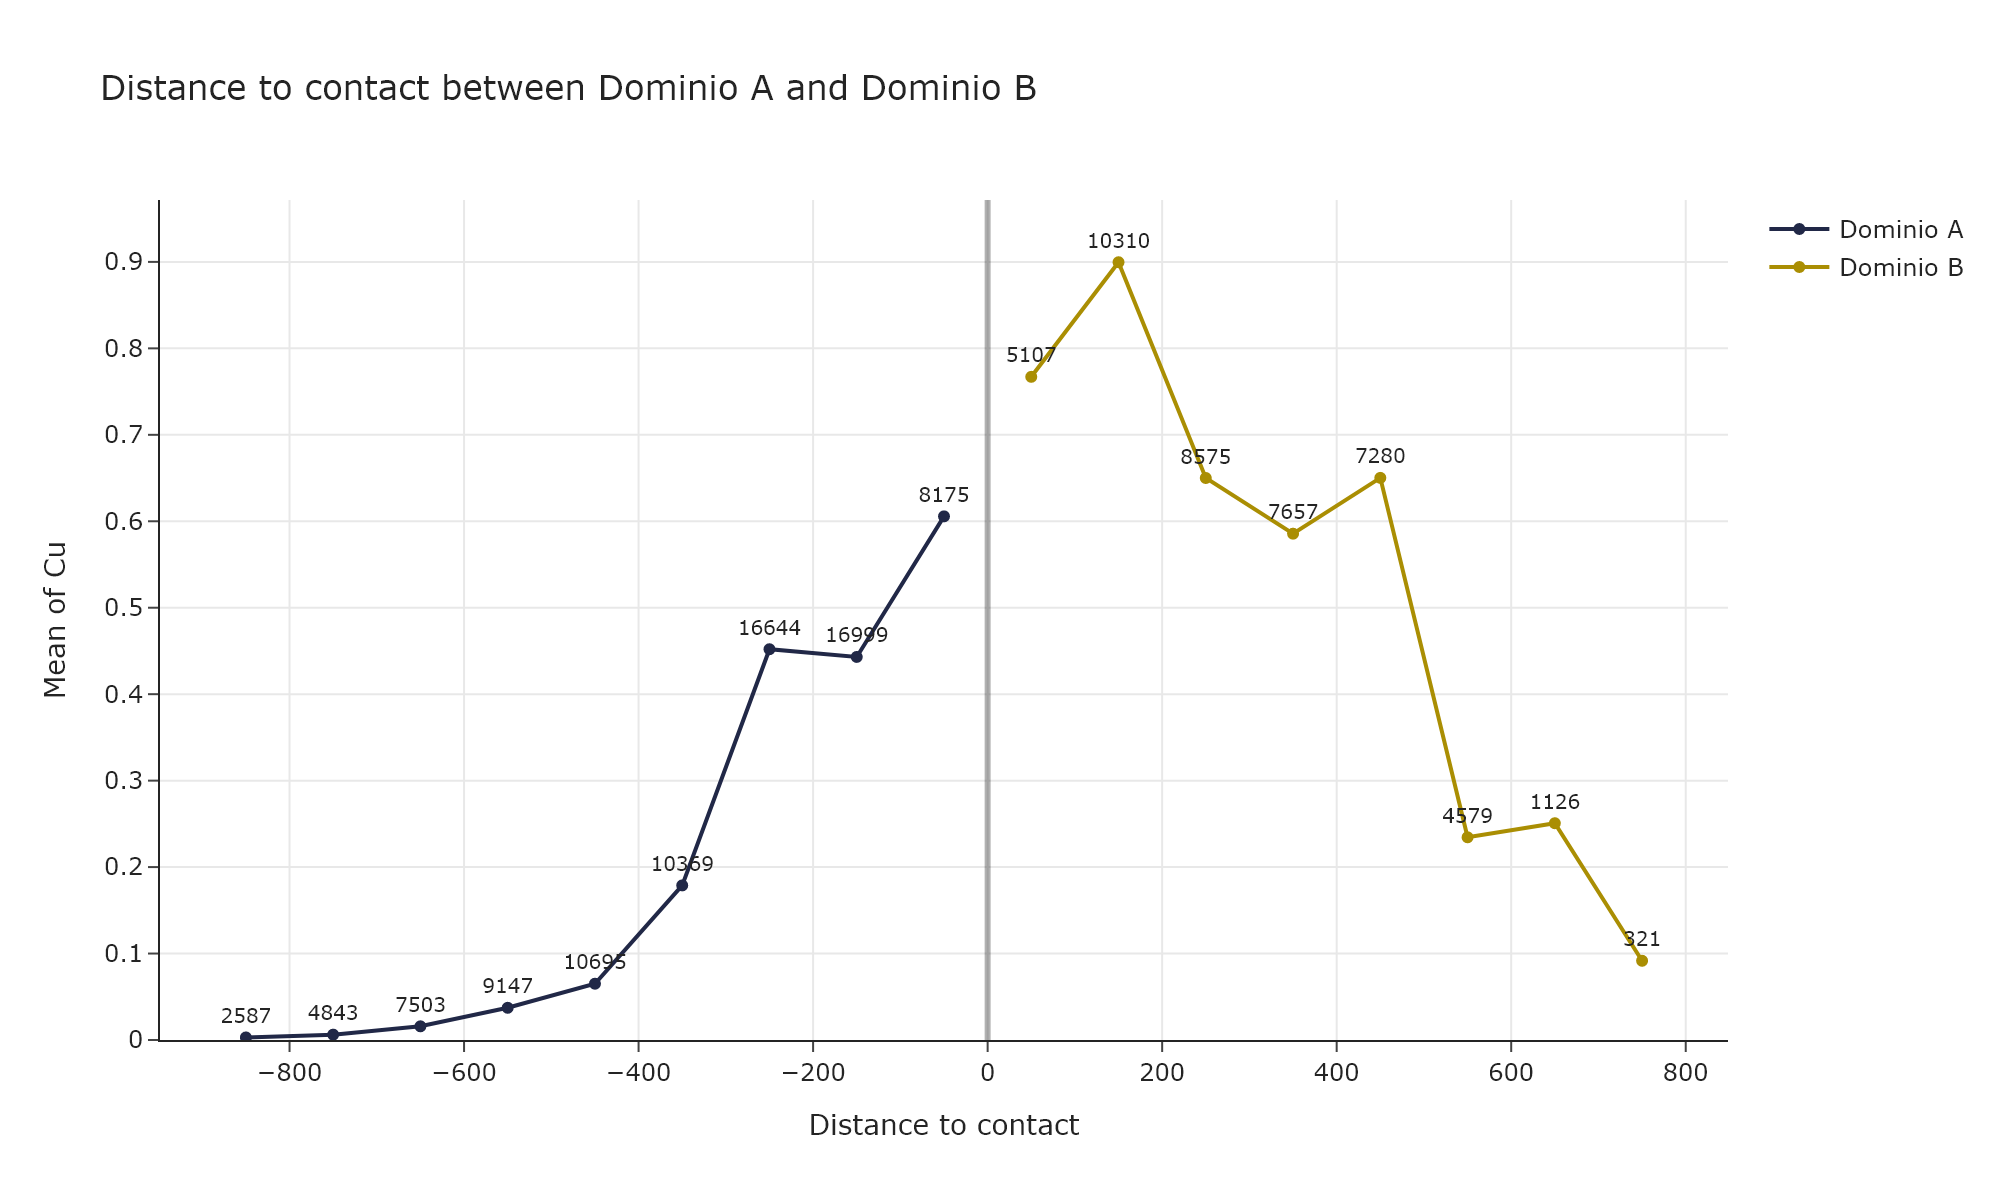
Supports the analysis of variable distribution and spatial variability. It includes tools such as box plots, histograms, cumulative probability plots, scatter plots, swath plots, contact analysis, and more.
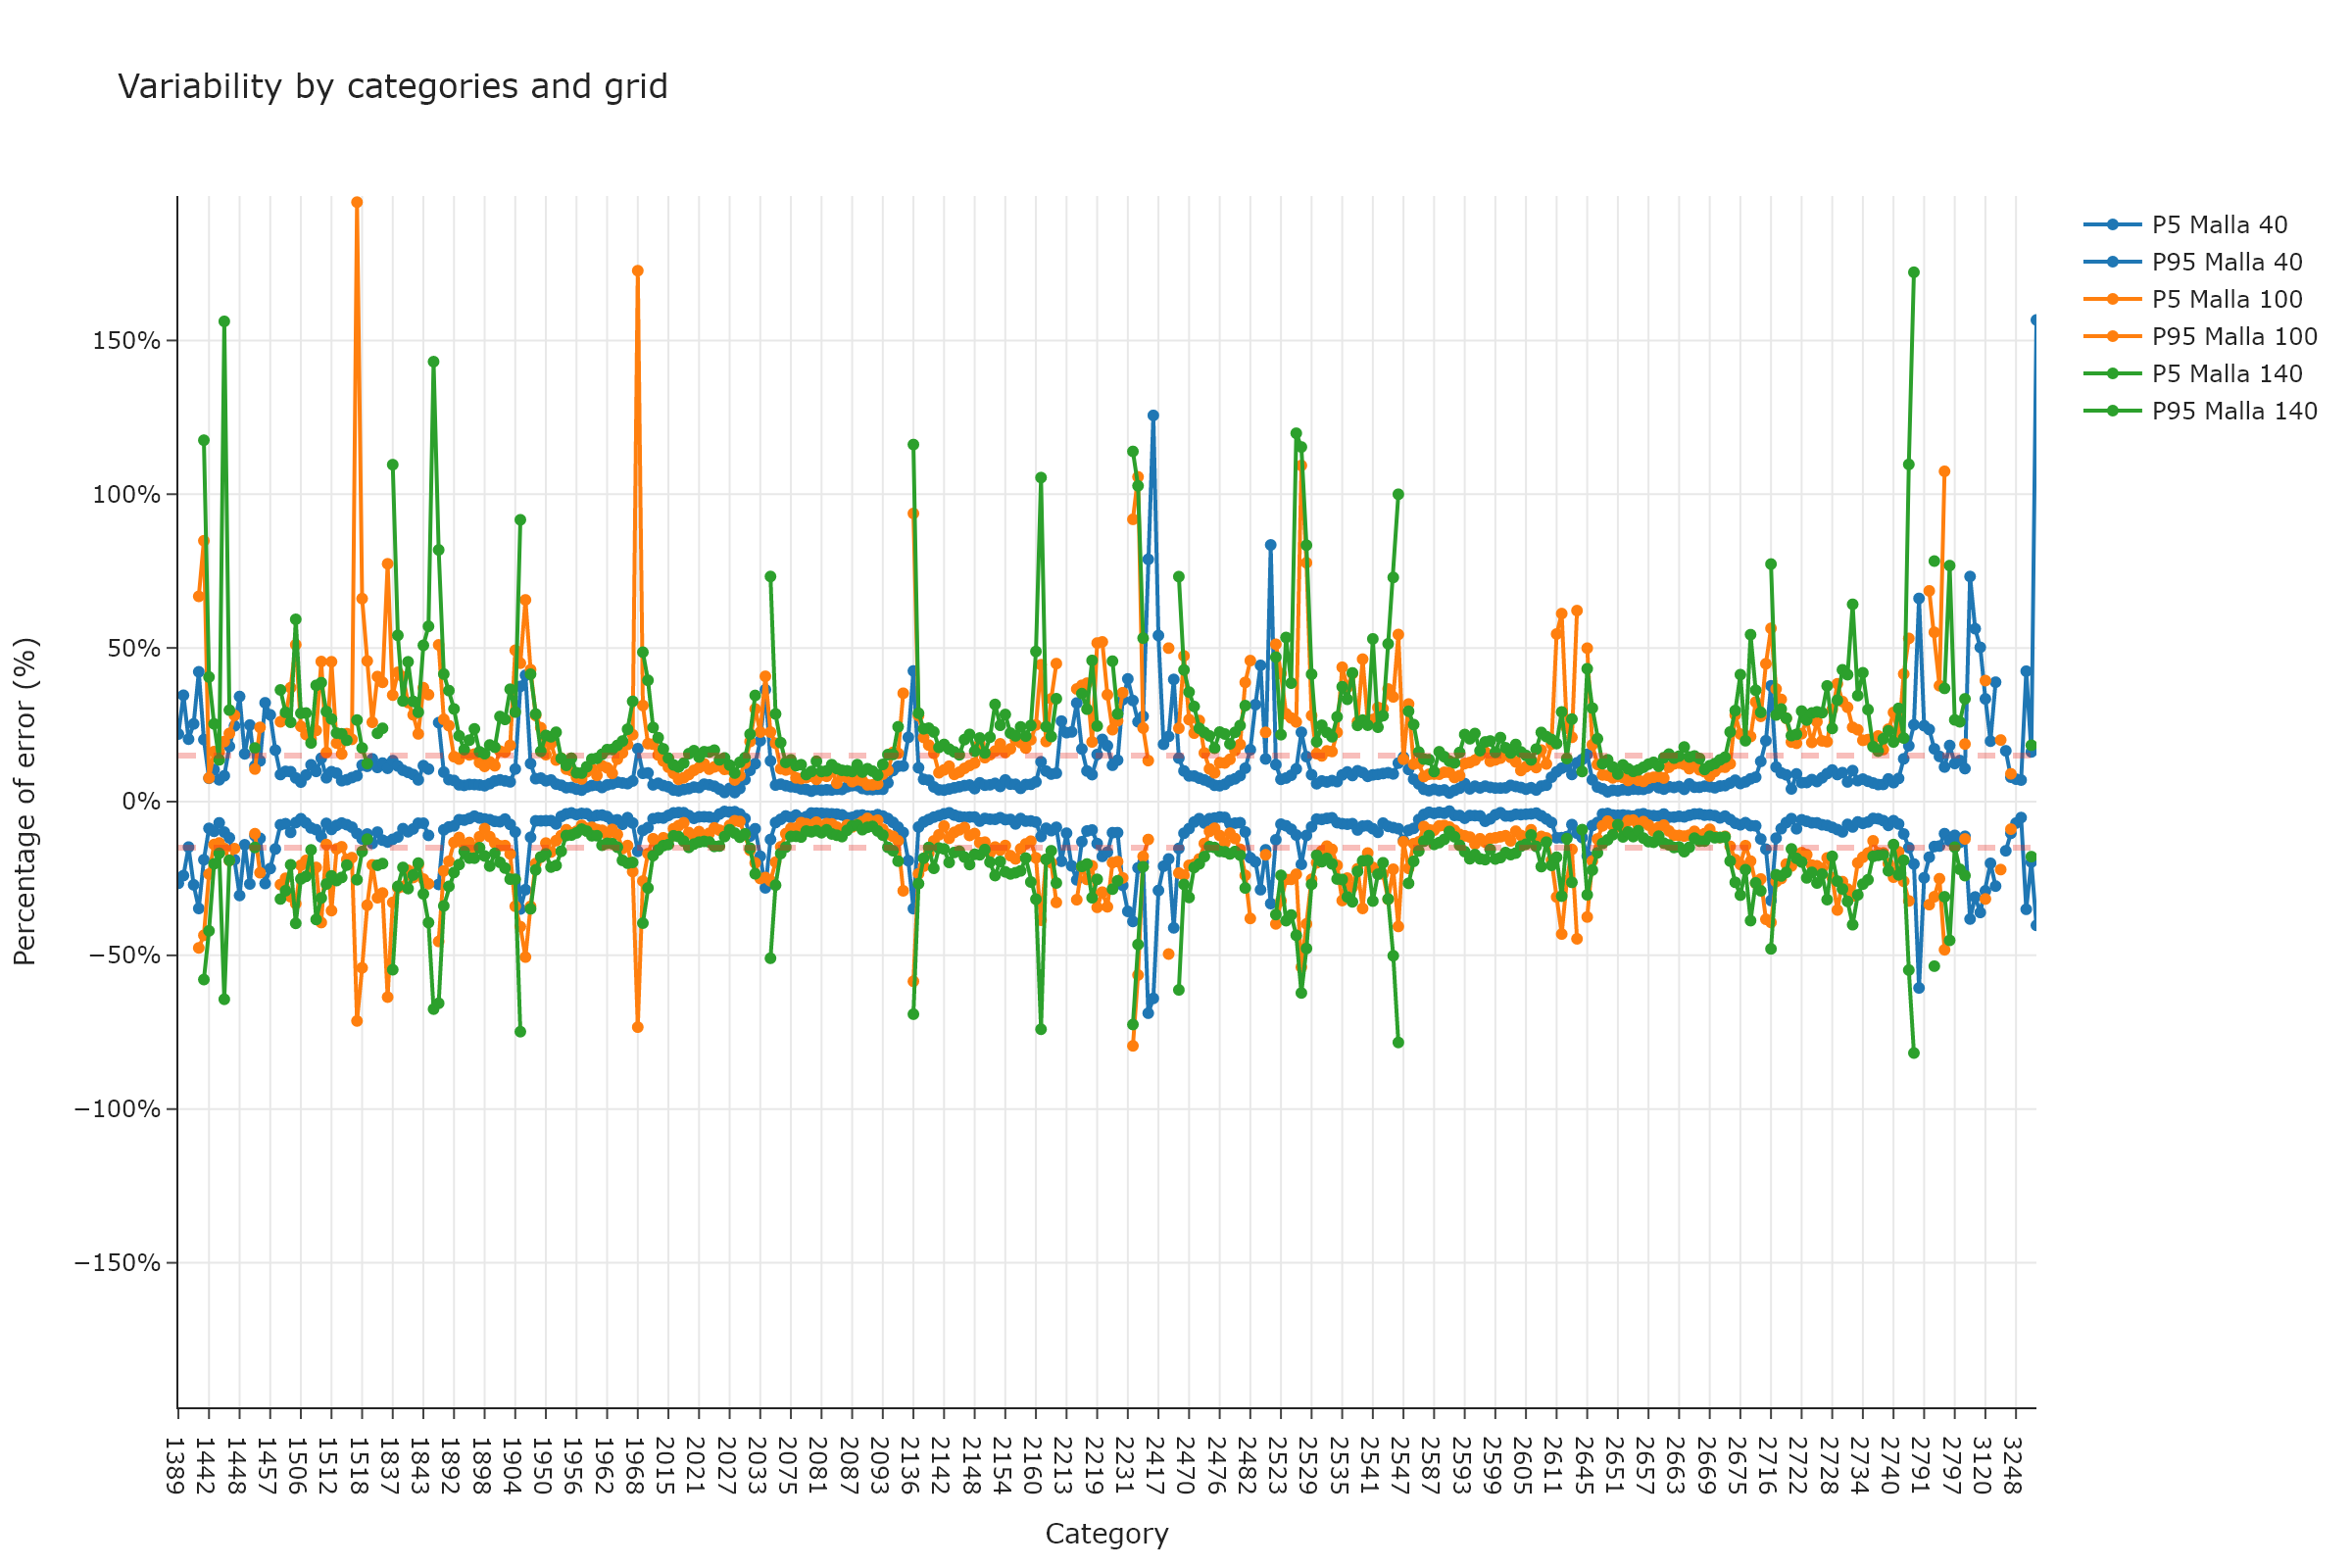
• Validation Module
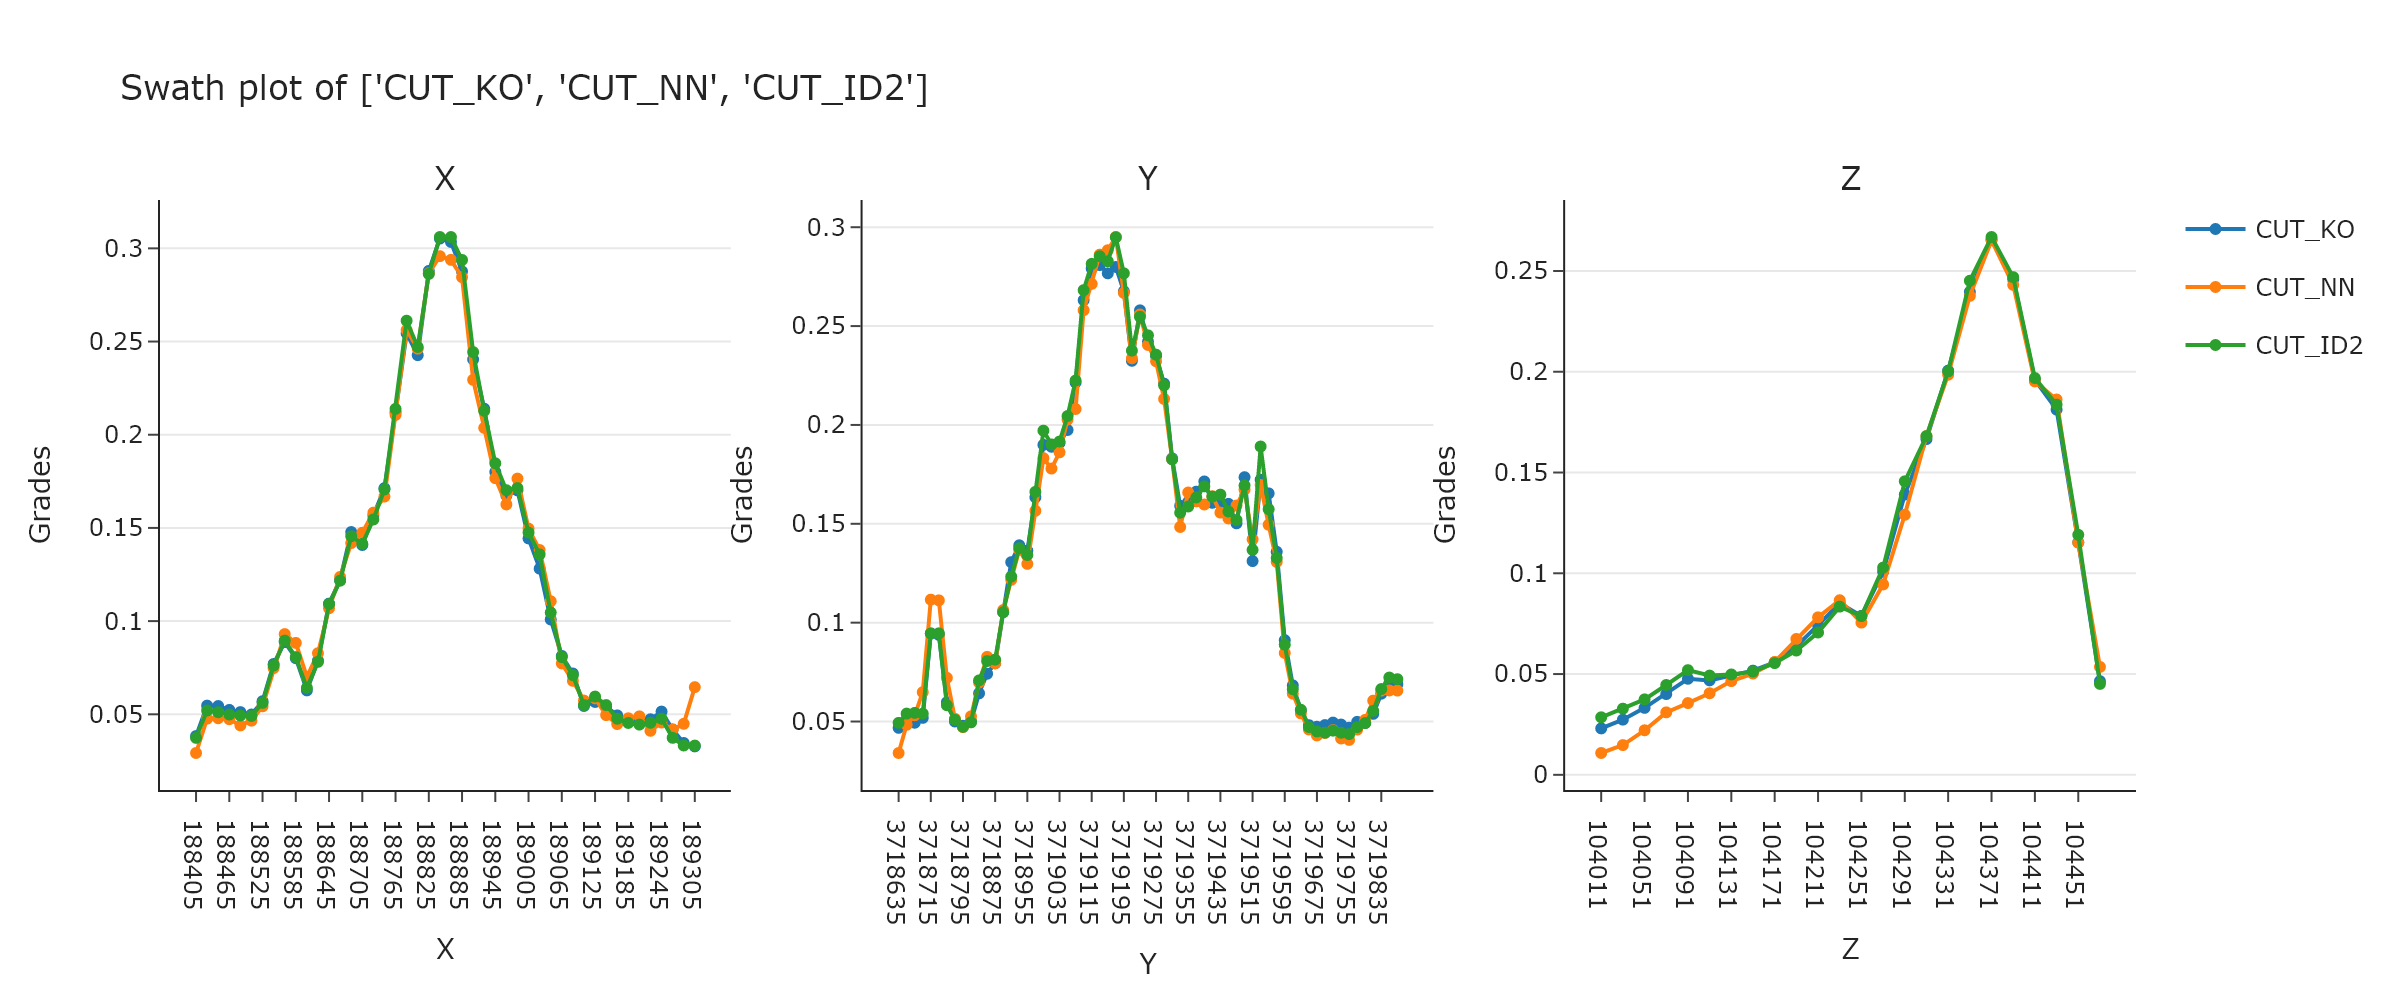
Contains the required plots to validate model results, such as grade-tonnage curves, swath plots, and superblock scatter plots.
• Geotools Module
Provides tools for validating simulations, generating Sankey-style diagrams (to visualise changes in resource classification), and tagging polygons directly on the block model.
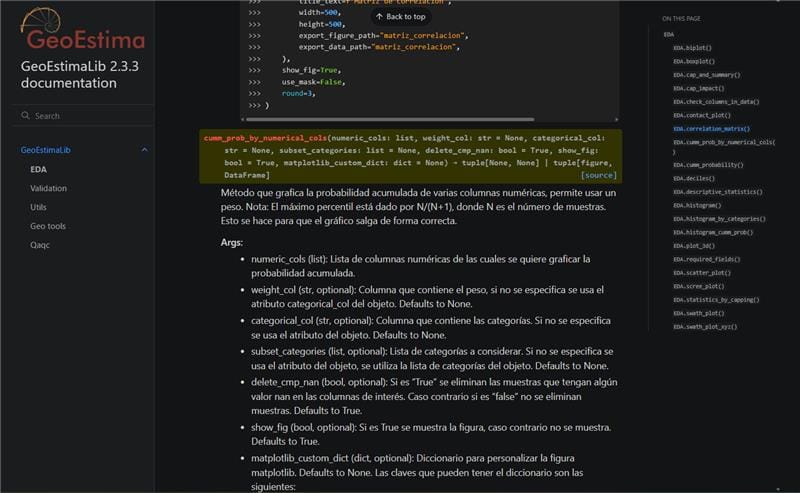
Best Practices: Testing and Documentation
To ensure code quality, each module includes automated tests that validate the mathematical calculations behind each plot. We also maintain internal documentation accessible to the entire team, detailing the use of each function, its parameters, and practical examples.
Below is an example of how to use the swath plot from the Validation module. First, the library is imported; next, an instance of the Validation object is created; and finally, the corresponding method is called with the defined parameters:
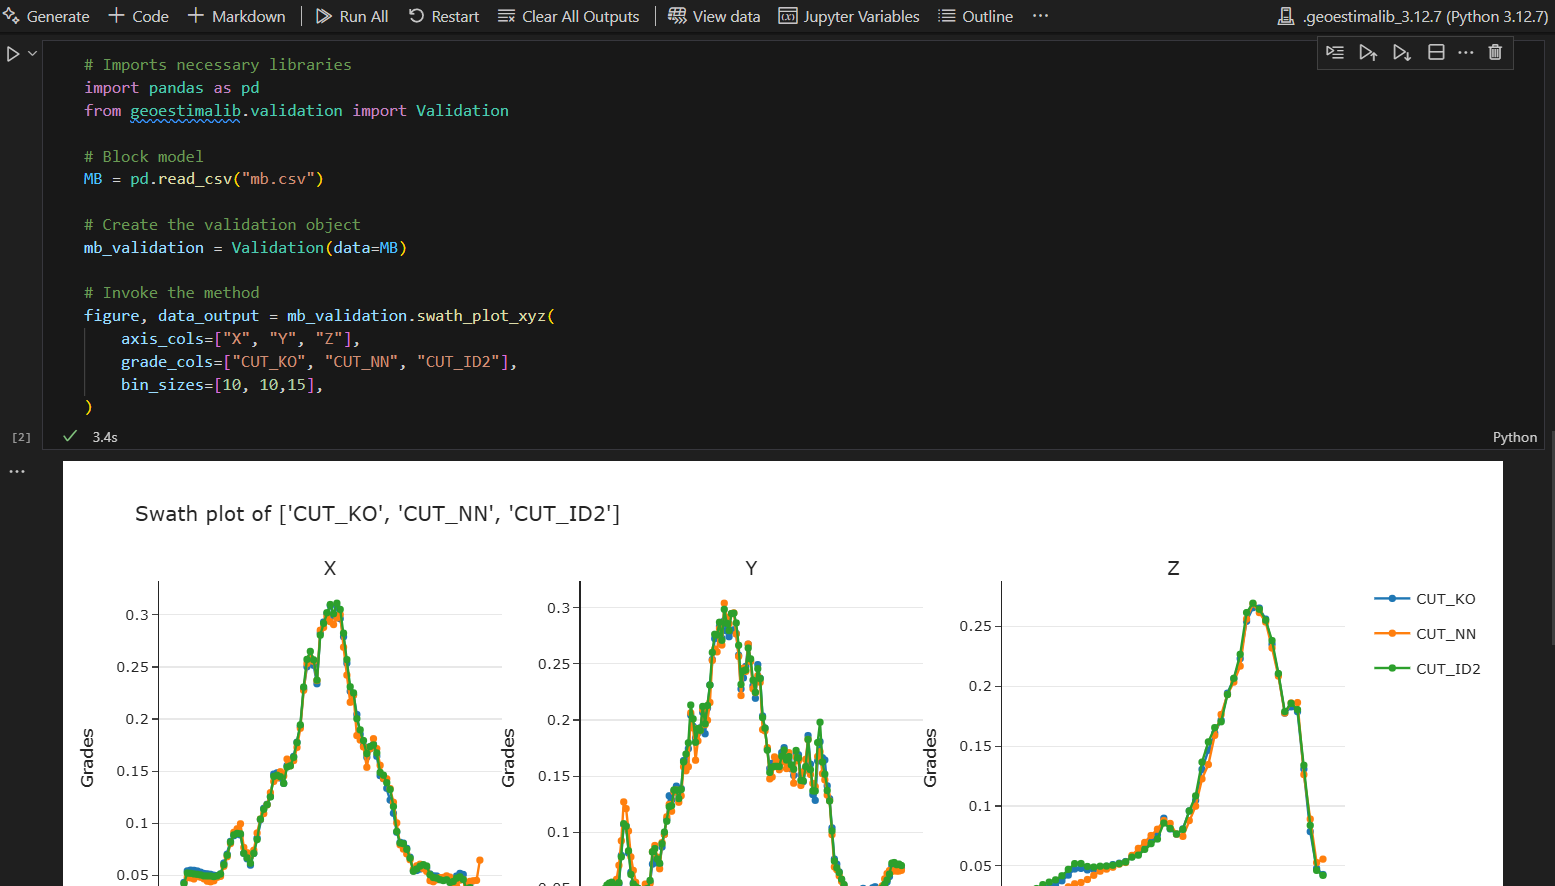
This type of interface is designed to simplify the use of the developed tools, enabling any team member to easily incorporate them into their analyses.
Looking Ahead
We are currently working on version 2.4.0, which will include new plots and functionalities aimed at further optimising our processes. Each new version incorporates improvements based on team feedback, as part of a continuous improvement approach focused on delivering more complete, intuitive tools aligned with our clients’ needs.